Who’s Getting Financial Inclusion Funding in Sub-Saharan Africa?
For the first time in over a decade, Sub-Saharan Africa is a top priority for international funders investing in financial inclusion, with 30 percent of all active projects focused on the region. Ten years ago, the 23 largest international funders who reported to the CGAP Cross-Border Funder Survey committed $1.73 billion to financial inclusion in Sub-Saharan Africa. By 2016, the year covered by our latest survey, that figure had climbed 270 percent to $4.7 billion. And funders say their strategic focus on the region is likely to stick over the next three years. So which countries are attracting the most funding, how is funding being used, and is the financial inclusion community’s investment making a difference?
There is clearly a geographic disparity in terms of funding allocation, and this appears to be driven by funders’ desire to invest in countries where they can have an impact on the most people. Ethiopia, Kenya, Tanzania, the Democratic Republic of the Congo and Nigeria top the list as the most funded countries. Home to about 470 million people, including over half of Sub-Saharan Africa’s poor population, these countries attracted almost a quarter of the region’s funding in 2016. Botswana, Guinea-Bissau, Lesotho, Mauritius and Central African Republic, on the other hand, were some of the least populous and least funded countries. They have a combined population of about 12 million people. The $25 million in commitments these countries received added up to less than 0.5 percent of the region’s funding.
Funding commitments and countries’ population size (2016)

Our data show that the bulk of international funding in the region – close to 70 percent – is intended to finance the growth of financial services providers (FSPs) who strive to reach low-income customers. However, funders allocated an additional 20 percent of the total committed amount exclusively to building the capacity of FSPs. Funding for capacity building is much higher than in other regions, where this figure is about 10 percent.
Do these purposes align with what is needed to advance financial inclusion in Sub-Saharan Africa? CGAP and MIX have been tracking funder commitments for over a decade, and we observe certain correlations between funding volume and financial inclusion progress – the latter typically measured using growth in account penetration, as a proxy. Comparing the funder survey with the Global Findex data from 2011 to 2014, we can see that with just a few exceptions, countries that have traditionally received the most funding have also showed the greatest increases in account penetration. Kenya is the most prominent example. As the most-funded country, it was able to onboard an additional 30 percent of its adult population into the formal financial sector between 2011 and 2014.
Progress in account penetration (2011-2014) and outstanding financial inclusion funding commitments (2016)
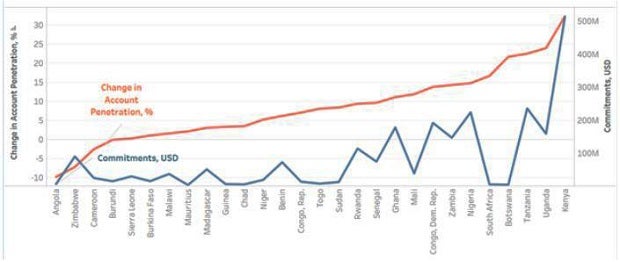
Of course, it is challenging to talk about direct causality between funding and progress because there are many factors that influence financial inclusion. Additionally, using account ownership as a proxy for financial inclusion doesn’t address use and quality of services issues, which may be even more important challenges right now than increasing access. Still, the correlation between financial inclusion investments and account penetration brings about several important questions.
First, have the funders’ efforts indeed advanced financial inclusion? In the case of Kenya, recent evidence suggests that the country’s dramatic progress coincided with the existence of FSD Kenya, a multi-donor initiative attempting to take a systems-wide approach to developing financial markets for poor people. For the other countries, it is harder to say. More evidence on the drivers of change and how funders contributed would be beneficial.
Second, in countries that have exhibited positive progress, are funders expanding their focus beyond access and use to promote the quality of financial services? From the Funder Survey, we can see indirect evidence of that. Seventy percent of projects funding FSPs have a capacity building component, and 20 percent of all projects attempt to use a holistic approach by going beyond just provider funding to pursue goals like improving financial infrastructure, supporting a protective and enabling policy environment and enhancing customers’ financial capability.
And what about those underserved countries? What will it take for funders to focus on them? The funder survey data are just a starting point to uncover these important issues. Funders should continue to reflect on their strategic choices, the best use of their instruments and their impact.
Resources
Also in this Series

Women’s Financial Inclusion: Are Funders Moving the Needle?
Many countries with significant funding for women’s financial inclusion are seeing a widening gender gap. What does this mean for funders?
Is Funding for Rural Finance Going Where It’s Needed Most?
Global funding for rural finance has risen to nearly $5 billion. Are funds reaching communities with the greatest needs?
Add new comment